Ian Bowie is a kiwi-Australian academic. He taught and researched in geography, town & country planning and environmental management at universities in New Zealand Australia and Scotland over more than thirty years. He practiced subsequently as a consultant planner in New South Wales. In his retirement in Bowral (NSW) he continues to teach and research material for courses for the University of the Third Age. More….
List of Posts [click on the links]
[the order is of first posting; the years are of the latest substantive update]
Early in my professional life I became interested in measurements – statistics – for establishing relativities in time and space to describe things such as trends, the past in present-day perspectives, marking positions in pecking orders and comparisons between places. This interest has been reflected extensively in my research on agriculture and rural land use at several levels.
For example, in the 1980s, asked to provide background material for a textbook on agriculture, I explored statistical data on countries and continents published by the Food and Agricultural Organisation of the United Nations (FAO) and World Trade Organisation (WTO) and discovered to my surprise that Australia wasn’t especially important on a global scale.
For all that we have both countries with more than a billion people located in ‘our’ hemisphere, much of our continent is effectively desert, most of our people are huddled or near in a few metropolitan urban areas (who happen to live on much of our best agricultural land), and we are towards the ends of the earth in relation to most of its population.
While the relativities have changed with the growing monetisation of the economies of developing countries, Australia remains a significant but certainly not pre-eminent country compared with China and India or the United States or European Union as either a producer or exporter of agricultural produce overall.
Although relativities change from year to year, 2016 (2015/6) was ‘average’ in terms of both the Southern Oscillation Index and economically across both Australia and the world. In that year, China accounted for 33% of the monetary value of agricultural commodities produced globally; India, the United States, and the European Union accounted for 12%, 9% and 11% respectively. Australia produced around 1% and ranked 20th internationally by values of agricultural commodities produced.
Of course, less than half of global agricultural production enters world trade. But, even as an exporter, Australia still accounted for less than 2% of global exports in 2016, ranking only 8th in a list of countries which included the United States (10%), Netherlands Germany and France (7%, 6% and 6% respectively), with the European Union totalling 38% (of which 2/3 was traded within the Union).
The picture is different for individual products and is complicated by the fact that while much agricultural produce is processed before it enters domestic and world trade. Australia is essentially a broad-acre producer and exporter of mainly unprocessed agricultural food and raw materials, in most of which it is seldom a large enough producer to be able to make, as distinct from take, agricultural prices.
Australia’s agriculture is thus at the mercy of fluctuating international prices and often a few unreliable importing countries as well as of its own nutrient-poor soils and challenging climates, things that politicians and the public at large seem disinclined to acknowledge — despite the efforts of the Australian Bureau of Agricultural and Resource Economics and Sciences (ABARES) to inform them.
Facing the double whammy of a growing population and climate change, Australia is far from being potentially a food basket for Asia. Indeed, according to the Prime Minister’s Science, Engineering, and Innovation Council (PMSEIC) in 2012 as well as ABARES it may have been a net importer of food in 2009 and it is likely to become a net food importer at least sporadically by 2050. Currently in a typical year Australia exports between 20 and 40 per cent by value of all its products with an agricultural origin.
Interestingly, while New Zealand has a far smaller area in agriculture than any of Australia’s mainland states except Victoria, the value of its agricultural production in 2016 was fifty percent larger than the value of production of each of NSW, Queensland and Victoria (each around AUD13 billion, making up 70 percent of Australia’s total). New Zealand exports a higher percentage of its agricultural production than Australia.
**********
At the other end of the geographical scale, small-area agricultural data collected officially since before the 1860s in New Zealand, Australia, and Scotland, often annually though more infrequently these days, have fed my interest in relativities at the local level, typically local government areas but sometimes smaller areas within these.
Although agriculture in Australia may be smaller and growing more slowly than other sectors of our economy it remains important for export earnings in good years and is the economic base for many small communities across the country. However, while it is the most widespread of economic activities and historically has been the only one of significance, it is easy to romanticise it.
Biophysical challenges mean that few regions (mostly small and scattered) are suitable for more intensive forms of agriculture. With cost-price pressures and rising real costs of transport, processing plants for dairy, meat, sugar, fruit, and vegetable produce have disappeared from many regions, along with suppliers. Australian agriculture has become increasingly a sector of broadacre farms.
With desertification and more extreme droughts also, our agriculture has become geographically concentrated — in the case of New South Wales, ¾ of its value of agricultural production in 2016 was from shires on the slopes and adjacent plains west of Great Divide in the better watered parts of the Murray and Murrumbidgee drainage basins.
My last adventures in crunching agricultural data were for an early established but now insignificant agricultural region east of the Great Divide in New South Wales, the Southern Highlands (or Wingecarribee Shire), which was done as part of my research on its local area for a University of the Third Age course on the Southern Highlands.
Initially my data was from the turn of the twentieth century, and it led to publication in WINGECARRIBEE, OUR HOME: A Geographical Interpretation of the Southern Highlands of New South Wales [pp 56 to 60 in the hard copy (2006, and e-book 2013), https://library.wsc.nsw.gov.au/uploads/94/wingecarribee-our-home.pdf%5D.
Since that publication I have periodically updated the images used in the book, and prepared many others, lodging them on a CD-ROM in Wingecarribee Central Library (Bowral) in 2018. I have no intention of updating the book because of the labour that would be involved but, given that some of its content is unique, I have updated an earlier (2009) paper on agriculture in the Southern Highlands (Wingecarribee Shire).
Little has been written about agriculture in the Southern Highlands, so I drew heavily for this paper on data published by the Australian Bureau of Statistics and its forebears. Once sparse and now in archived reports, statistical data for relatively small areas is available for today in almost overwhelming detail, so I have sought to navigate through this to tell a story.
Some of my graphs may be of especial interest because they quantify the steady growth in agriculture followed by decades of uncertainty through the century from 1861 (when there was little to show for fifty years of ‘frontier’ development), and the half century of steady decline that has followed since as the region morphed from being a rural backwater into a playground and rural extension of urban Sydney.
The graphs represent areas synonymous with the Southern Highlands (data is available earlier for smaller areas only from Police collections, and from agricultural censuses over the last decades). They were hand-drawn originally, have been revised several times and lack a professional finish. The paper is not particularly profound, but it does suggest possibilities for further research.
Notably, the paper points to difficulties caused for understanding the dynamics of land use change in a region where commercial agriculture is challenged by both biophysical limitations and competition for rural land, and by changing minimum thresholds for reporting of agricultural census data by the Australian Bureau of Statistics over the past five decades.
It would be beyond my time but could be rewarding for an understanding of land use change for a comparative analysis to be done of agricultural census results from 1991 (the 2021 results were published in mid-2022) for the Southern Highlands and other regions where agriculture has been similarly affected by demand for rural land for non-agricultural uses.
The paper hints at the difficulties of comprehending a place in broader spatial and temporal perspectives. For example, although information published by historians might be read as suggesting otherwise, the fact is that agriculture in the Southern Highlands was not of great significance even in its heydays in the early decades of the twentieth century.
Indeed, even in 1879 for which a detailed Statistical Report on the Police District of Berrima is available, sheep and cattle numbers and the area (and number) of agricultural holdings in the Wingecarribee were larger than ever in the twenty-first century, while the area in crops albeit that it is larger now remains tiny. In a New South Wales perspective the region has never really been significant.
With much of the rural land in the Southern Highlands locked into a structure of small holdings that has changed little in more than just the last five decades, finding long term futures for commercial (as distinct from less-than-commercial) agriculture in the face of uncertain economic as well as biophysical futures may call for imaginative and even brave solutions.
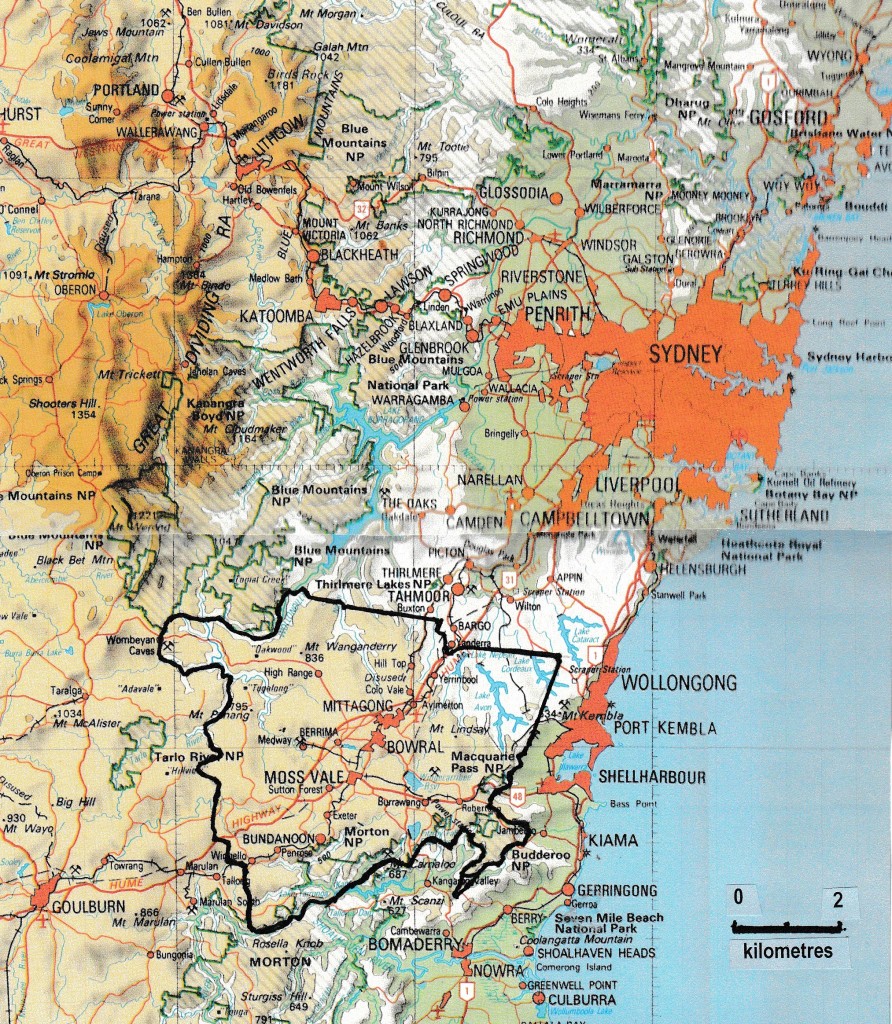
The Southern Highlands of New South Wales in context (AUSLIG 1:250,000 mapping), Source: Readers Digest (1994: 84/85), Atlas of Australia. Readers Digest Association (Australia), Sydney, 2nd edition Note: this statistical area (SA3) is very similar in extent to Wingecarribee Shire except in the southeast where the Shire does not extend as far as the SA3
**********
Postscript on Agriculture in the Southern Highlands (Wingecarribee Shire), 2023
Estimates from its latest five-yearly survey of agricultural establishments by the Australian Bureau of Statistics, of agricultural areas, livestock numbers and values of commodities produced in Wingecarribee Shire in 2020-21, mostly showed continued declines since 2015/16.
The total area of agricultural businesses and the total value of agricultural commodities produced (VACP) both fell by more than twenty per cent (to 43,129 ha and $38.2 million respectively) although the number of agricultural businesses grossing $40,000 and above changed little.
Numbers of dairy cattle halved (to 3700), meat cattle numbers also fell (to 18,359) but sheep numbers doubled (to 26,395). Areas of most crops other than wine grapes also declined.
However, VACP rose for some crops so that, while cropland remains negligible in area, the total VACP of crops ($12.6 million) rose to be close to those of both the dairy and the meat cattle farming (milk products accounted for $9.1 million and all cattle sales and slaughters $13.7 Million). The VACP from each of grapes, sheep, and potatoes continued to remain small.
Despite the general declines, there was a small increase between 2016 and 2021 in Census numbers enumerated as working in agriculture in the Shire (to 648, still only 3% of people working in the Shire), perhaps reflecting some intensification of horticultural cropping and possible expansion of hobby farming.
So: while there’s a lot of open space in the Wingecarribee there remains not a lot of commercial agriculture.
I became aware of Norfolk Island in the early 1950s when New Zealand’s NAC (National Airways Corporation) flew scheduled air services between Auckland and this tiny Australian piece of Polynesia. NAC had taken over the operations of the RNZAF 40 Transport Squadron in 1947 when the last New Zealand military personnel departed the island which had been occupied by N-Force and other New Zealand and some Australian forces from 1942.
At that time, my perception of the Norfolk Island ‘story’ was of the island as the home of Pitcairners descended from HMS Bounty mutineers and their Tahitian women. That perception was paramount in my mind when Beetle and I first visited the place in December 1994 (in a tiny plane from Lord Howe Island, a matter of days after Seaview Airlines had resumed flying rebadged as TransPacific Airlines, having been grounded for a couple of months after the loss of its Aero Commander plane on 2 October).
Small, remote, isolated and an island: Norfolk Island from the south
On the island, inevitably, we became aware of the many remains of penal settlement in Kingston and elsewhere but had too little time to explore them. What we did not know then was that most of those are from a second penal settlement. We learned of the earlier one a few days after our return to Sydney where a cousin asked over lunch ‘Did you not know that we had convict ancestors on Norfolk Island?’
So, we made a second visit in September 2010, returning from New Zealand via Auckland and by Air New Zealand. We still did not learn much of the story of James Morrisby and Ann Brooks then and spent more of our visit getting better to know the island’s landscape and history than researching my ancestors (for which the Kingston and Arthurs Vale – KAVHA – museums and interpretation, for instance of the remains of the recently discovered Polynesian settlement, were then still in their infancy).
In March 2020 again by Air New Zealand, we joined a group organised by Cathy Dunn of Australian History Research to commemorate the 230th anniversary of the wreck of HMS Sirius on 19th March. During this visit, equipped with copies of archival documents, we learned more especially about the first penal settlement – and still had time to do some bush walks, and to swim in Emily Bay (surely one of the prettiest and safest lagoon swimming places in the Pacific).
That was an ‘interesting’ week! The supermarket was empty because the supply ship hadn’t arrived as scheduled. The Territory declared a cyclone State of Emergency on our second day and its covid Emergency two days later. And, with 2G telephony then, we were not exactly in touch with the world. These things gave colour to our understandings both of issues that confront small remote populations and of the event of 230 years before which left James Morrisby even further exiled from his earlier life than by his convict transportation.
Over time, our knowledge – and the public promotion also – of the Norfolk Island story has evolved from awareness of the Pitcairners’ story to a fuller biophysical and socioeconomic understanding of the Island. So, while planning for a fourth visit in 2021 (this time by Qantas on its first regular services to the island since 1977) to the place where my Australasian family history began, I began to prepare a course on Norfolk Island for the Southern Highlands’ University of the Third Age (SoHiU3A).
In casting around for a conceptual framework within which to understand the physical landscapes of the Island I was influenced by my background as a geographer and planner with professional experience in heritage conservation. The landscapes of today are expressions of a layered cultural past. Some of those expressions as they have developed over time, as well as their primary documentation, have been judged to be of world heritage significance.
For such a small place there is now a remarkably extensive literature on both the natural and the cultural history of Norfolk Island. In my reading, I’ve been guided by the concept of sequent occupance, because this framework enables us to understand the landscapes of the island as expressions of processes of evolution rather than of a series of notable events. I summarise my application of this framework to the island and reference some of my reading in the linked piece. [please click on the link for a PDF file]
As suggested by data from the various Censuses of Norfolk Island in the tables below the island is now much more than the home of just descendants of the Pitcairners or of people who identify culturally with ‘Pitcairners’. For examples, most of the island’s residents since the 1950s have been born off the island (many in New Zealand as well as on the Australian mainland) and most residents since the 1980s have not had a significant Pitcairner descent.
Curiously, given the Polynesian ancestry of Pitcairner descendants, there seems to be limited interest on the island in its remains of a pre-historical Polynesian settlement. Also curious, given that many Pitcairner descendants have ancestors also from people who came to the island with New Zealand’s Melanesian Mission which had a separate presence there, is the fact that little emphasis is given to the role of that Mission in the development of an Islander culture. Reflections of New Zealand’s military occupation of the island during World War II are similarly ignored.
Of course, cultural identity derives from more than simply birthplace and ancestry. The teaching of Norf’k-Pitkern on the island meant that in 2021 many more Island residents (667 out of a total of 2190) claimed to speak this language than the 556 who claimed Pitcairn as one of their two preferred ancestries. The matter of identity is complicated by the long history of Pitcairn descendants ‘marrying out’ and the long associations of some non-Pitcairner descendants with the island.
With the arrival of newcomers, and with ever-closer ties to Australia, Pitcairner culture has morphed into the more cosmopolitan and complex Islander culture, and the landscape has evolved to reflect these changes. In the landscape now, there are traces of no less than six separate and largely unlinked sets of occupants (if the short wartime occupation by New Zealand forces is included). All of these traces need to be understood better, in order to conserve them properly.
Norfolk Island’s people share cultural traits with other communities in Australia and across the Pacific that are similarly small, remote and isolated, but the complex and layered history of Norfolk Island is unique. Today’s landscape there is a physical expression of this. Sequent occupance is a way of understanding the landscape, with the help of the extensive documentation of the island’s society and its environment.
It should be noted that reported census populations almost invariably are undercounts and that is likely the case for Norfolk Island. However, the Australian Bureau of Statistics estimated the resident population of the Territory on 30 June 2021as 2220, which is close to the census count for 10 August 2021 reported above and there has been little change in the estimate since 2021.
Topographical Map of Norfolk Island and Philip Island
source: AUSLIG, in Readers’ Digest Atlas of Australia (1994)
‘When I use a word’, Humpty Dumpty said, in a rather scornful tone, ‘it means just what I choose it to mean – neither more nor less’ (Lewis Carroll, Through the Looking Glass).
Karl Marx used the slogan ‘from each according to his ability, to each according to his needs’ to state a core principle for tax-and-transfer systems. Politicians like to talk about ‘middle income’ as a way of seeming to adhere to this principle. That was a justification given at the time for legislating progressive reductions in tax rates on personal incomes in 2019 which remains unquestioned at a time when further reductions are being brought forward for higher incomes.
While income from work is still the principal source of income for Australian families it may not be the principal source of income for many individuals, which suggests that wage and salary income alone is not fit for use as a base for our tax-and-transfer system (including for measures of poverty). Moreover work-related incomes are skewed upwards from normal distributions, with average incomes being much higher than middle (ie median) personal incomes.
In the piece attached, published in Pearls and Irritations before the September 2020 budget, I drew on two sets of data on personal income in Australia, namely the plethora of data on tax-assessable personal income reported annually by the Australian Taxation Office (ATO) and a similarly large data-set on the personal income of residents aged over 15 enumerated in Censuses of Population and Housing. The two data-sets cover non-work as well as work-related income.
please click on this link for a referenced PDF file about Middle Income in Australia….
While the ATO and Census data-sets are derived very differently both are reasonably comprehensive of personal incomes. Given their differences, the middle (median) incomes revealed by the two are sufficiently similar one to another (ie just under $46,000 in 2017/8 according to ATO data and around $39,000 in 2016 using Census data) for it to be clear that middle personal income is a lot lower than middle wage-and-salary income.
Whether it is in ignorance, talking down to voters, or virtue-signalling to their sponsors, the loose manner in which politicians use terms such as ‘middle income’ does them no credit. Small wonder that repeated calls for coherent reform of our tax-and-transfer system and for other reforms that go to the core purpose of our economy, to deliver goods and services, get ignored in favour of continual tinkering.
It is interesting but sad to note that if the Australian Federal Parliamentary Remuneration Tribunal continues to recommend increases in the basic remunerations of Federal Parliamentarians in the normal way to 2024/5 then the base remuneration of these Parliamentarians after income tax (excluding levies) will have increased by a third in money terms since 2017/8 (before the start of a three-stage reduction of income tax rates) and by twelve per cent since 2020/1 (when the second stage was implemented).
Calculating this in 2020, implemented of the third stage of the Stage Three Tax cuts in 2024 would have given a further windfall increase in the after-tax income of a Parliamentarian foot-soldier on the basic Federal Parliamentary rate, of eight per cent!
It may not be unreasonable for Federal Parliamentarians to be remunerated at rates far above levels of middle income in Australia and not unreasonable for them to expect annual increases in line with those recommended by the Remuneration Tribunal . But for Parliamentarians to support, with little dissent, reductions in tax rates that that give themselves windfall increases in their take-home pay suggests at best that neither they nor most income earners much understand incomes in the real world.
Postscript (2024)
The foregoing was written prior to the Commonwealth Government making changes to Stage 3 of the tax cuts before they were implemented in 2024/25. These changes benefitted all taxpayers (individuals with taxable incomes over $18,200) rather than just higher income taxpayers than had originally been proposed in 2018, with smaller increases to the after-tax incomes of high-income earners.
None of the changes proposed in Stages 1, 2 or 3 have affected the forty percent of income-earners who either have taxable incomes below $18,200 or whose personal income tax returns are not enumerated in the Tax Office’s annual Taxation Statistics. Most of the changes remained for the benefit of individuals with personal incomes significantly above ‘middle income’.
Nor do any of the changes address the chaos which is Australia’s tax-and-transfer system, in which the Commonwealth dominates tax collections (especially if the mandated superannuation contributions collected by private corporations are considered to be ‘taxation’ as in other countries) and States, Territories and local governments are increasingly dependent on the Commonwealth for funding.
An often overlooked aspect of that tax-and-transfer system is the covert manner in which superannuation is funded. Rather than collecting compulsory superannuation contributions through the tax system, the Commonwealth government outsources the collection to private sector corporations which have become extraordinarily profitable and powerful since these collections began in 1992.
Mostly, although not entirely, these corporations are for-profit entities from which the profits go to the owners of the corporations rather than to superannuation account holders, with the Commonwealth government offering no especial guarantees of their funds to superannuation account holders – with members of the Commonwealth Parliamentary Superannuation scheme being exceptions!
This is of little relevance to people with lower than middle incomes who will remain dependent on the Commonwealth for Age Pensions. Still, with something like five percent of GDP now going annually into compulsory superannuation guarantee levies, Parliamentarians need to reflect on the role of private corporations in this – when their own superannuation being backed up by the Commonwealth’s Future Fund!
The successful operation of the Future Fund gives lie to any fears that a public-sector superannuation scheme might be neither independent of governments that could see such a scheme as a potential ‘hollow log’, nor likely to be less profitable than private-sector corporations. However, it is hard to see Parliamentarians of any stripe being much concerned with this or the wider tax-and-transfer system when they have little understanding of who gets what that goes much beyond their own experiences!
I have mixed feelings about today’s preoccupations with family history in ‘western’ countries. I suspect that a lot of genealogical research reflects widespread desires to find identity and importance, or at least meaning, for our lives; and a significant industry has grown up to exploit these desires, something made possible by official passions in the last couple of centuries for recording things and by the recent rise of the internet.
I suppose however that we’re all a bit like the small child who asks ‘where did I come from?’ and there can be practical reasons for knowing something of one’s genetic and ethnic origins. So, for some decades I have been working on my family history, initially in a somewhat desultory manner and choosing then to draw on information put together by various cousins, but more recently in a more focussed way and drawing on other records.
Those other records include a copy of letters sent to one of my paternal great grandmothers (Henrietta Letitia Smith), which are now with the Canterbury Museum in New Zealand, and of other nineteenth century letters and notes made by her family. These letters and notes got me hooked on family history because they hint at mysteries that remain unsolved despite the clues that have been unearthed by other family members.
Increasingly, I have been drawn away from family records and into public archival records which have come on-line. Increasingly, also, I have felt compelled to write up what I know ‘know’ and to put copies of ‘my’ records into electronic form. In 2016 I put my ‘history’ into a document which I entitled My Generations which I donated to the Archives of the Canterbury Museum and the Aotearoa Collections of Christchurch City Libraries.
In 2021, I revised this history and posted that version for readers who may be interested in some of my Bowie/Broom, Baker/King, Smith/Morrisby, Smith/Langford, Caesar/Schindler, Fry/Cowper, Gardner/Nazer, and King/Buckingham great-great-grandparents. No doubt some of the details might change as new information is uncovered, notably as others match their family trees to shared familial DNA, but I have confidence in the substance of the stories I’ve told here.
Now, in 2023, I think that I have done as much as I am able to document ‘my’ family history and, so, I am posting here an updated iteration of this story as My Generations 2023 (please follow the link below). I have deposited a digital copy of my now substantial collection of images and documents that support my story with New Zealand and Australian genealogical societies as Bowie Family Files 2023.
My Tasman Sea: circles are spaced at 500km; compass points are true only at the centre. Norfolk Island (asterisked) is roughly 1250 km NNE of the centre point
While reviewing what I’d written then on my Norfolk Island convict ancestors, I observed that there were inconsistencies and discrepancies in what others have said in hard copy and online, which I could resolve only by checking their information against primary sources, other original records, and my family records. In the process of doing this I have come to understand why it has been said that ‘much rigour can lead to rigor mortis’!
Family historians rarely cite their sources but, to do so with clear and complete referencing, requires a discipline that I certainly have not had. So, when challenged in 2021 to cite my Norfolk Island sources, my effort to corroborate what I and others have said became both an intense effort to find sources and an essay into historiography. I have had to revise the story several times since then as I have obtained further information but I doubt that I will be adding further to the story.
That particular story focusses on James Morrisby who arrived in Australia on 20 January 1788 when the British “First Fleet” rendezvoused in Botany Bay (New South Wales), and Ann Brooks who got together with James on Norfolk Island to become my great-great-great grandparents and who arrived in Port Jackson on 3 June 1790, both having been transported onwards to Norfolk Island as convicts (and moving later to Van Diemen’s Land as free settlers).
I am posting the short story here because it will be of wider use and interest, and it has end notes that amplify this story, albeit that my referencing is not perfect….
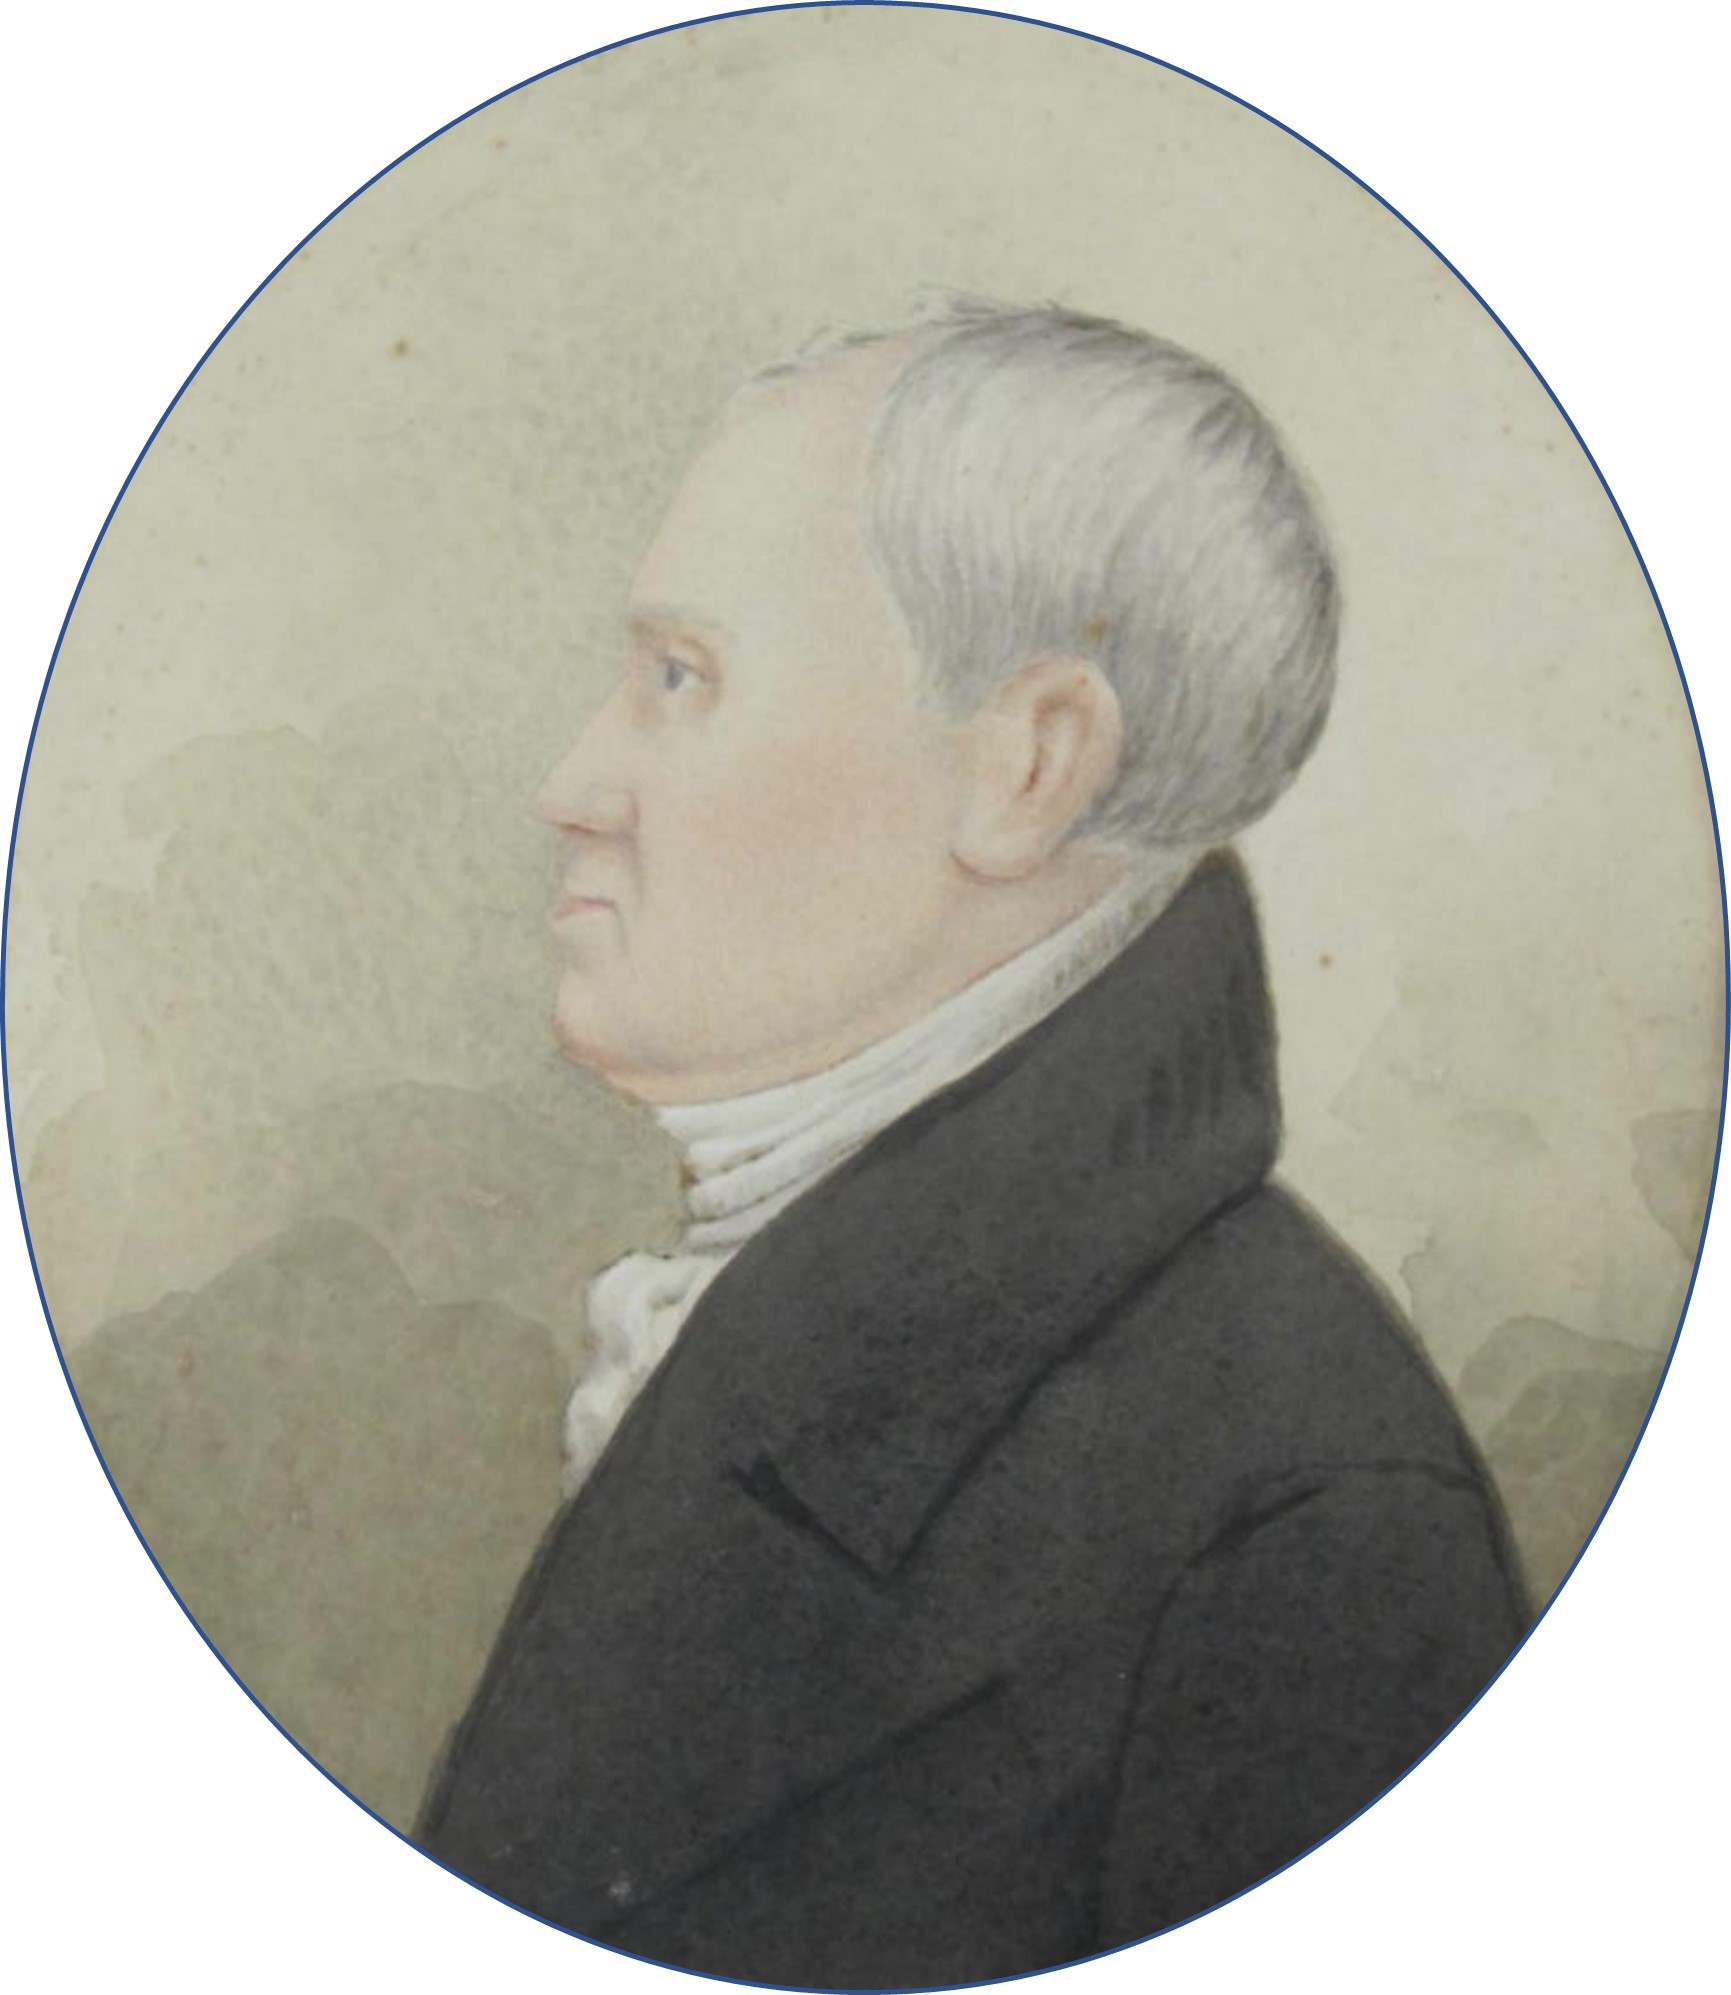
James Morrisby,1757-1839 (Tasmanian Museum and Art Gallery)
In the process of checking my sources for the story of James and Ann I was given a copy of a memoir written about 1980 by Edwin Morrisby about James. While this memoir may not be a record of all Ted Morrisby’s research it does appear to be the source of some of what has been reported (and repeated) about James. As such and because it adds colour and context to James’ story, Ted’s memoir should be in the public domain.
So, I have edited the text of Ted’s memoir in 2022 and have added endnotes that reflect some of the primary information that has come to light in the decades since Ted’s pioneering research. I am posting the edited version of Ted’s memoir here….
Others might be interested also in the origins of the other half of ‘my’ family, my wife’s family descended from Anglo-Jewish Benjamin and Hart (along with Moses, Nathan, and other) ancestors from England and Western Europe, and from her Eastern European-Jewish Len and Kirsner (with Listkow, Yudelson, and other) ancestors, in both Australia and Europe. I have assembled a story about them also, which I post here….
Again, while this story does not contain illustrations or references, we have deposited a large digital collection of images and documents as Kirsner Family Files 2023 with genealogical societies in both Australia and New Zealand for those who might want to explore what we have uncovered.
Inevitably the stories will change as new records come to light and as interpretations of the facts change. I hope that the contributions here will be of use to future family researchers.
Local government is the poor relation in the governance of Australia. Although it is the level of government closest to ‘the people’ it is also the level that arouses least interest. For instance, in New South Wales where voting is ‘compulsory’, typically between twenty and forty percent of enrolled electors don’t vote in local elections or cast informal votes.
I have long wondered why electorates are so disengaged. True, local government has been so emasculated by state government that local councils are often little more than branch offices of state government. True also, that we punters have little way of judging the performance of sitting councillors, let alone aspirant ones. But how might these issues be addressed?
Is the ‘board of directors’ model for councils, current under the Local Government Act, the best way of reflecting and representing community views? Is the current State Government’s ‘regional scale’ model for councils the best way of maintaining a connection between councils and their constituencies? Is NSW Treasury’s obsession with ‘financial fitness’ of councils an appropriate way to judge the performance of councils – and councillors? Should local councils have a role in the delivery of local public goods such as schooling?
I suspect that part of our problem lies in the somewhat ad hoc way in which local government has evolved, without much purpose except to deliver services not provided by higher levels of government, and in their relentless pursuit of efficiency State Governments – and the elites who determine their agendas – overlook the grassroots origins of local government.
From the end of the 1990s, when the NSW Government was pursuing a reform agenda for local government, I wrote several papers that expressed views on local government from which I do not resile two decades later.
One of these was a short piece published in New Planner, the magazine of the planning profession in New South Wales, in 1999 (number 39, p24). Its thrust was to question a popular view, that we need fewer and larger local government areas….
A second paper circulated in 2002 developed ideas about putting the ‘local’ back into local government, which had grown out of my reflections on the structures and functioning of local governments in jurisdictions outside Australia….
A third paper also circulated in 2002 enlarged on relationships between local communities and local governments and their implications for the effectiveness of local government, with reference to Tables of comparative data on local governments in various jurisdictions in the OECD….
The Tables in the third paper suggest that a wider range of public services is often delivered by local government in jurisdictions outside Australia, which enables these jurisdictions to have more, and more localised, local government than here. An interesting exception is the case of Norfolk Island where, being a Territory of the Commonwealth, a ‘regional council’ delivers services that are elsewhere associated with both State and local governments.
We tend to be somewhat myopic in Australia when it comes to how other countries and indeed other States and Territories do things, but perhaps local government is a case where we need to know more about what happens beyond our borders.
Obviously, my data on middle and local tier governments across the OECD is dated. Perhaps an analytically-minded reader might care to update them, although I doubt that this would change the picture greatly. Local government appears to be healthy in other democracies; maybe we can learn from them. It might strengthen our relationship to government generally.
The world is a place of infinite diversity. We carve it up into different bits in order (among other reasons) better to comprehend it. New Zealand is a place of great diversity too and, thinking about how I might approach it for the purposes of a University of the Third Age course on Aotearoa/New Zealand, I wondered whether there might be a more meaningful way of approaching this diversity than starting with the conventional division into North-and-South.
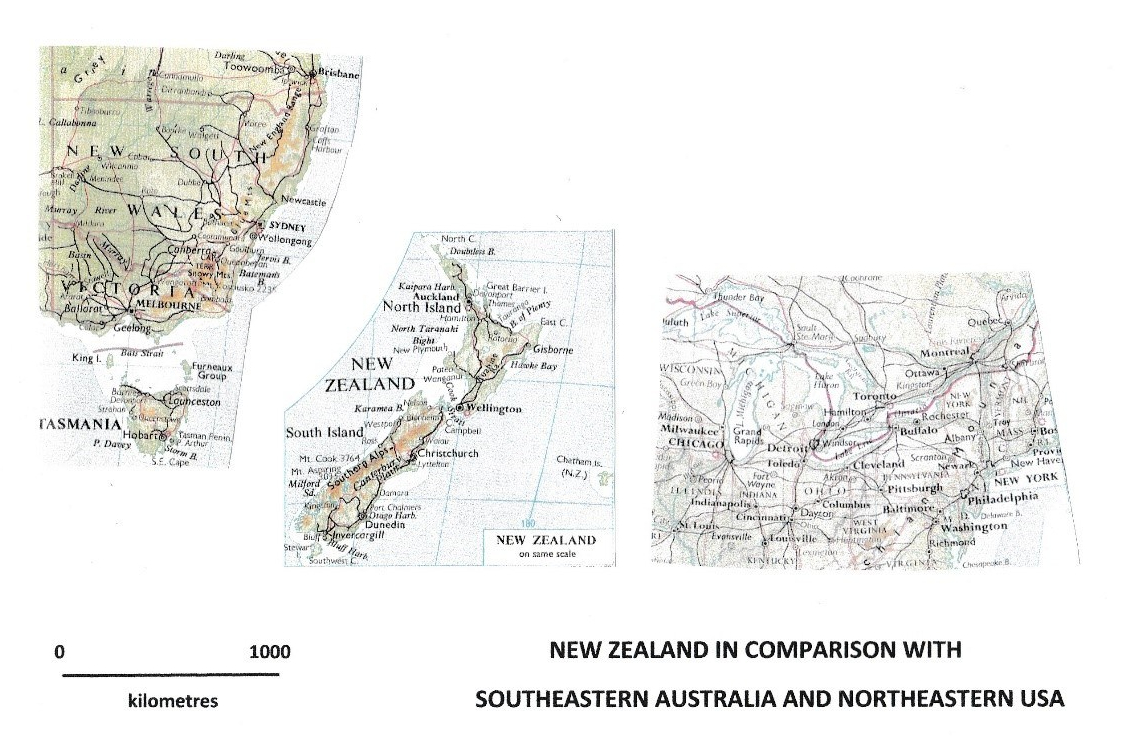
New Zealand [known also as Aotearoa, a Māori name applied to its North] is a smallish island country in the South Pacific whose latitudinal dimensions are comparable with those of many larger continental countries (as suggested in the map below)
Aotearoa/New Zealand has two main islands, North Island (Te Ika-a-Māui) and South Island (Te Waipounamu). Others, including Stewart Island (Rakiura, in the south) and Chatham Island (Wharekauri), are of lesser significance, so Cook Strait (Raukawa) between North Island and South Island appears to be a convenient start for carving up a country – into North-and-South. However, Cook Strait is less of a separation than it might appear.
Geologically, both North and South Islands are parts of the same subaerial mountain chain formed along the boundary between the Pacific and Australian plates. The mountains run more or less parallel to the Alpine Fault and its extensions into the fault system of Marlborough in South Island, which continue in a north-easterly direction in North Island parallel to the Wellington fault system and faults further north. There are significant coastal plains to the east in both islands.
This mountain chain gives rise to climatic variations between east and west in both islands which are as significant as any variations associated with nearly thirteen degrees of latitude for the country’s biogeography and human landscapes. Cook Strait meanwhile historically has been more of a unifying feature than a separation, for the people of at least the central regions of the country. So, perhaps an East-and-West binary division might be more useful than a North-and-South one?
To test this idea, I looked at some basic data relating to land cover, population and economy from New Zealand’s Ministry for Environment, and Statistics New Zealand, for the sixteen ‘Regions’ into which New Zealand is currently divided for administrative purposes. For practical reasons, data for two regions, Tasman and Nelson, were combined while those for Marlborough and Wellington which contain elements of both East and West were allocated to ‘the East’.
A map of the regions and tables with the data on which my North-and-South and East-and-West binary divisions rest are attached in
The totals for the North/South and East/West binary divisions expressed as percentages of New Zealand totals are compared in the table below. Broadly speaking, the East/West division produces a more nuanced picture of contrasts in land covers, but it does inflate the importance of ‘the East’ in New Zealand’s population and economy by the inclusion of the Wellington Urban Area [hatched on the map] there rather than in ‘the West’.
Obviously, these divisions could be refined by using more localised data, such as to include other areas also such as the Marlborough Sounds [hatched on the map] in ‘the ‘West. They could be refined also by using other data also, such as the farm type data included in Table 2 of the attachment which points to the greater relative importance of dairy farming in ‘the West’ compared with ‘the East’ where sheep/beef farming predominates on both exotic and indigenous grassland.
Neither the North/South nor the East/West divisions of New Zealand reflect concentrations such as of population (especially of ethnically Māori) and to a lesser extent exotic forest in the northwest quadrant of the country. A regionalisation more detailed than binary divisions would be needed to highlight these. However, the East/West division does reflect better than the North/South the concentration of cropping on the plains of the drier east of both North and South Islands.
The East/West division also shows better that ‘natural’ land covers, such as mountain wastes, indigenous grasslands, native forest and scrub are prevalent throughout the country – although the bulk of the first two are concentrated in the south and east.
Any binary division of New Zealand will have limitations but, although a North-and-South division is convenient, a division into East-and-West appears better to reflect the landscape diversity of Aotearoa/New Zealand.
New Zealand: percentages of land covers, population and gross domestic product accounted for in North/South and East/West binary divisions
NORTH SOUTH WEST EAST
TOTAL AREA 2016 43 57 49 51
Exotic forest 70 30 58 42
Exotic grassland 51 49 41 59
Crops/horticulture 32 68 21 79
Urban 70 30 60 40
‘Natural’ covers 32 68 45 55
CENSUS POPULATION 2018 77 23 64 36
Ethnically Māori 2018 86 14 69 31
Gross domestic product 2018/9 78 22 63 37
Sources: NZ Ministry for Environment; Statistics New Zealand
As a kiwi-Australian from a pākehā background (though neither ethnicity is recognised by the Australian Bureau of Statistics), I have views on inter-ethnic and multi-cultural relations that reflect my upbringing in New Zealand and a lifetime of observations around the world. While I am uncomfortable essaying on Australia’s Indigenous issues because this a minefield in which there is much conflict and a great deal of misinformation, I think that the three posts below contribute to the discussion.
………………..
How many Aboriginal Australians are there? (2020)
My first piece went to the heart of perceptions, official and otherwise, as to who in Australia are indigenous and for whom Indigenous policy should be targeted. It is an expanded version of a piece first published without end notes in Pearls & Irritations in 2020:
For some years I had been involved in ‘News in Review’, a course run by the University of the Third Age in the Southern Highlands. The course involved members choosing a news-medium opinion piece as a starting point for discussions that then occupied each meeting. During 2017 I chose a piece by Samantha Disbray which discussed issues to do with the early education of indigenous children [https://theconversation.com/why-more-schools-need-to-teach-bilingual-education-to-indigenous-children-79435].
For me that opinion piece highlighted the problems of delivering public services to small and remote communities, regardless of ethnic affiliations, and it alerted me also to the inadequacies of official data on the geography and demography of indigenous people in Australia: how many people, such as Aboriginal or Torres Strait Islanders and their dependents, live in these small communities is simply not known.
Australia’s Bureau of Statistics publishes data on what it describes as ‘indigenous’ people but it doesn’t define ‘Indigenous’. It is often said in Australia that to be indigenous requires a defined percentage of Aboriginal or Torres Strait blood in a person’s ancestry. That is not so. Without entering into debates about ‘first nations’, the High Court of Australia set down three explicit tests for Australian Aboriginality in 2020 (Love & Thoms v Commonwealth of Australia).
These tests, which are as much concerned with ethnic identity as with descent, should be the basis for indigenous policy and until the tests are reflected in its enumerations of Indigenous Australians by The Australian Bureau of Statistics we simply will not know how many Australian Aboriginals and Torres Strait Islanders there are in Australia.
New Zealand’s experience and indigenous issues in Australia (2020)
The second piece arose as a response to suggestions particularly since publication of the Uluru Statement (2017) that Australia might learn from New Zealand’s history of managing indigenous issues. I was not so sure.
New Zealand’s experience with an indigenous minority which is both more numerous and more homogeneous (ethnically as well as racially) than the indigenous peoples of Australia has been very different to that of Australia, and perhaps more straight-forward. I argued in the piece that New Zealand’s Treaty of Waitangi is not a model that Australia can follow, but New Zealand’s legislative approaches to indigenous issues may offer ways for Australia toward reconciliation.
Indigenous issues are inherently complex. They arise out of not only descent but also more nuanced questions about how people live. They are part of a broader suite of multi-cultural issues. Reducing indigenous issues to ones of ‘Black’ versus ‘White’ – conflating race and ethnicity and then characterising people and their protagonists on the basis of colour or appearance – simply gets in the way of reconciliation and social cohesion.
To quote Mencken ‘For every complex problem there is an answer that is clear, simple, and wrong”. My observations on Aotearoa New Zealand’s experience with its Indigenous affairs, first published in Pearls & Irritations without the end notes in 2020, support Mencken’s proposition.
An Update on Indigenous numbers in Australia (2022)
In 2022 I updated for Pearls and Irritations my observations in the earlier opinion pieces to reflect data from the 2021 Census. The post here, to which a link is provided below, is a referenced version of that updated piece.
While the2021 census reflected notable improvements in census collection of data and had a vast improvement in responses to the ‘ancestry’ question (more than a quadrupling of numbers who reported Aboriginal and/or Torres Strait islander ancestry in 2016) the ABS continued to ask census questions about ‘origins’ and ‘ancestry’, rather than about ‘descent’ and ‘ethnicity’.
I wondered whether this reflected a reluctance to let go of the concept of ‘race’. That concept was embedded in Australia’s Constitution, notably in section 51 (xxvi) which empowered Parliament to legislate ‘for the people of any race for whom it is deemed necessary to make special laws’ (as it did when legislating for an Aboriginal and Torres Strait Islander Commission (ATSIC)); there seemed to be little concern in current debates about the Constitution that this could be used in an adverse manner.
Instead, their focus was on entrenching a special power in the Constitution for Parliament to legislate an Indigenous ‘Voice’ to advise it about the needs and wants of Indigenous peoples rather, say, than give voice in a Preamble or the Constitution Act 1900, to the realities that Aboriginal and Torres Strait Islander peoples have occupied what is now Australia for perhaps 100,000 years (and that they and their cultures have been trashed over the last few hundred).
A ‘Constitutional’ Voice for any minority could risk exacerbating ‘racial’ disharmonies and socio-economic disadvantage, if it were to advocate separate development in regions where history and geography have marginalised non-Indigenous as well as Indigenous people. The power might simply embed yet another intractable problem into Australia’s nineteenth century Constitution.
The risk is magnified when an estimated 5.6% of the estimated national population was not enumerated by the census in 2021, and 4.8% of those who were enumerated did not indicate an Indigenous status. These mean that the size of any small minority – especially at local and regional levels – simply cannot be known with certainty, which would reflect on the legitimacy of an Indigenous ‘Voice’.
None of this is helped when the intent of census questions is not clear, particularly questions on origins and ancestry, which gives rise to results that cannot safely be used as proxies for descent or ethnicity, in the case of Aboriginals and Torres Strait Islanders in line with the 2020 test applied by the High Court. The ABS needs to be more precise in what its censuses do.
The Commonwealth has enumerated [some] Australian Aboriginals and Torres Strait Islanders in censuses since 1911. But, we still do not know how many Indigenous people there are in Australia!
My earlier pieces pointed to an uncomfortable fact that we simply do not know how many Australians personally identify as Indigenous, either exclusively or with other ethnicities. And, although Indigenous issues remain contested in Aotearoa New Zealand, they are addressed with less noise there than in Australia.
[My experience of publishing them was also an amusing but embarrassing way of learning that standard keyboard configurations do not recognise vowels with macrons above them — and many other special characters — in this case, through finding ‘Māori’ reproduced as ‘Mori’].
For example, New Zealand’s experience with its legislated Māori Council since 1962 demonstrates how an elected advisory Indigenous voice can inform public discussions about ‘sovereignty’ and ‘treaty’ as well as helping towards Indigenous recognition, reconciliation, and redress. It also demonstrates that building consensuses about these issues is slow and contested.
In Australia, a discussion about mandating an Indigenous ‘Voice’ in the Commonwealth Constitution has distracted attention from substantive issues. Talking about legislative details that are for the Commonwealth and State Parliaments to decide obscures the question of whether an explicit provision in the Constitution should be made for for any class of Australians, let alone one on the grounds of the ethnicity of that class.
Enshrining the concept of a ‘Voice’ in the Commonwealth Constitution would achieve little. It wouldn’t even amount to formal recognition while the Preamble and the covering clauses (clauses 1 to 8) of the Commonwealth of Australia Constitution Act continue to state that the Constitution (which is clause 9) expresses the wishes of ‘the people’ of ‘the colonies’ of Australia.
Noting that most of the States have modern Constitutions, the Commonwealth should re-enact the covering clauses in The Constitution Act which currently enable the nineteenth-century Constitution, among other things to recognise that the people of today’s Commonwealth embrace Australians of both Indigenous and other origins.
Together, the Commonwealth and the States need also to develop a national framework within which to address Indigenous recognition, reconciliation, and redress, including formal ‘Voices’ to represent Indigenous Australians.
Such a framework would require uniform legislation across the Commonwealth and States, rather than a patchwork of Commonwealth and State laws. A Referendum on altering the Commonwealth Constitution is simply a distraction from the real task of developing a coherent system of Voices to speak for Indigenous peoples – whoever they may be – at State as well as National levels.
Instead, while national Indigenous advisory bodies have come and gone despite the Commonwealth Constitutional changes of 1967, the States (Victoria with its First People’s [sic] Assembly, and South Australia with its First Nations [sic]), and the ACT (with its Aboriginal and Torres Strait Islander Elected Body), are going down their own and separate paths!
Constitutional Law is not for bush lawyers. Australia and its States need to enact ‘Voices’ for their Indigenous peoples, and to entrench the concept of Indigenous Voices in their legislation. These are matters for leaders, lawyers, and legislators, and cannot possibly be resolved by Referendums. Pseudo-legal debates about words in the Australian Constitution can resolve nothing.
As a planner I prepared conservation management plans and other heritage reports for government and private clients. Mostly, these were not published and are now buried in archives. An exception was Miss Traill’s House: Draft Conservation and Management Plan prepared on behalf of the Miss Traill’s House Management Committee for the National Trust of Australia (NSW).
This draft plan was published as Miss Traill’s House: draft conservation and management plan / prepared by Ian Bowie on behalf of the Miss Traill’s House Management Committee for the National Trust of Australia (NSW) (1994) and may be accessed as such in the National Library of Australia and several libraries of legal deposit in New South Wales.
Miss Traill’s House, in Bathurst NSW, is a rare ensemble of house, grounds, and collections of moveable heritage, all of which had associations with the extended Lee and Kite families of its last private owner, Miss Ida Traill, who left it to the National Trust of Australia (NSW) in 1976 as the ‘Lee Bequest’ in memory of some of her forebears.
In 1992 the National Trust formed a committee to manage this property which had been presented to the general public as a house museum in an ad hoc manner since it accepted the property in 1977. The committee was charged with overseeing the property’s day-to-day operations and with preparation of a conservation and management plan.
It was agreed that I would lead preparing a draft plan and in due course the draft was completed (except as to references) and submitted to the National Trust in 1994, with copies offset printed for public exhibition. At that point the Trust embarked on one of its period restructurings and proposed to mothball the property (though it later backtracked on closing the property).
Planning for heritage conservation and management is challenging. Often, little is known in detail about subject places or items, making it difficult to assess their heritage significance objectively. Without formal assessments of significance, conservation and management risk being reactive. But the process of getting to a plan is inherently political and sometimes controversial.
In the case of this property the draft plan was shelved, and a ‘final’ plan was not completed for the National Trust until 1999, by Ian Stephenson, Shelley McKerrow and Rebecca Jones, drawing on some material from the draft and using my name as an author. Unlike the draft, which remains in the public domain, that final version was subsequently archived and never published!
Assessments of heritage significance should be the bedrock on which resources are allocated to the protection, presentation and promotion of heritage items. They should rest on the best available evidence in order to identify priorities for their conservation and management and to allocate resources as they become available.
More than half of the 1994 draft was given to: documenting the separate evolution and provenance of house, the grounds and items of movable heritage; back-grounding the ‘Lee Bequest’; and formally assessing the heritage significance of the three components of the property. The remainder of its 150 substantive pages set out a conservation philosophy, and proposals for conservation and management.
The documentation and supporting plans, tables and images, were extensive because published records touching on the evolution of the property were fragmentary. With the help of library research, newspaper references, municipal council records, National Trust records, early photographs and oral memories, extant fabric in the house and grounds was explored and the inventories of movable heritage analysed.
Assessing significance was challenging because, while the gestalt had associations with members of Miss Traill’s extended family, the house, grounds and many items of movable heritage had significance in their own right because of associations with earlier occupants and other people of note, or as representative examples of the evolution of buildings and grounds, or of items of movable heritage.
Also, as shown in plans, the house and grounds had been much altered in form and details from the small late Georgian cottage and the undeveloped land taken up in 1845 by the Reverend Thomas Sharpe. As the house had evolved so had its grounds and by 1976 only an area known as the ‘horse paddock’ (which had been sold but later repurchased) remained undeveloped.
And, while items in Miss Traill’s collections in 1976 included many family heirlooms (more than a third of the movable items had known connections to her extended family), many of her domestic and decorative items also had intrinsic (and sometimes substantial monetary) value in their own rights as examples of Australian and European arts and crafts.
Drawing on the documentation, a conservation philosophy was developed which focussed on the property as the Lee Bequest and on Miss Traill’s occupancy, while acknowledging the earlier owners and allowing for both its further evolution as a house museum and much-needed restoration work and ongoing maintenance in the house, the grounds and the collections.
This conservation philosophy then led to recommendations and priorities for action set out in the later parts of the plan (and its appendices). But, with the draft plan now forgotten and the ‘final’ plan buried in an archive, it seems that the content of neither will much influence understanding or the ongoing conservation and management of Miss Traill’s House.
As Robbie Burns said ‘the best laid schemes o’ mice an’ men gang aft a-gley’. Few plans are ever fully implemented; for various reasons many don’t get to the point where they even inform action. In that process, information documented in them gets forgotten. That may be a waste of resources, perhaps, but it’s what seems to happen to rather a lot of plans, draft and otherwise.
I do not know what makes a ‘climate scientist’ but some of my academic teaching and writing was on weather and climate and my professional engagement with climate change included running a Commonwealth-funded seminar on The planning implications of Greenhouse in 1992.
Other involvements with the human-induced aspects of climate change have included membership of Climate Action Network Wingecarribee Inc (CANWIN) for which, in 2007, I prepared a technical note summarising information that was then available on Greenhouse gas emissions and Australia, to which I add the link below.
While the detail in that note is now dated much of the commentary still remains apposite as Australia’s leaders have continued to justify their climate-inaction on the basis that domestic greenhouse gas emissions in Australia account for only a small share (eg1.3%) of annual global greenhouse gas emissions!
That seemingly un-referenced number, widely quoted since the 1990s, may have been correct but it avoided the fact that (using sources cited in my 2007 note) in 2004 a further 2½% of annual emissions came then from coal and gas exported by Australia, and more than one per cent was embodied in goods and services including petroleum products imported by Australia, what are now known as ‘Scope 3’ emissions.
For a country with only 0.33% of the world’s population, being implicated in nearly five per cent of annual global greenhouse gas emissions then was hardly a matter for national pride or avoidance. A decade on, with Scope 3 emissions embodied in our burgeoning coal and gas exports and rampant consumption of imports included, the Institute for Energy Economics and Financial Analysis has calculated that the percentage had risen to 9.7 in 2019. Even less to be proud about!
Although my 2007 technical note relied on estimations I’m publishing it here because, while Australia may claim that it is on track to meet its 2030 target of a reduction in annual domestic emissions of up to 28% on 2005 levels, we have in fact doubled our share of annual global emissions over the same time if Scope 3 emissions are included, and that share is rising.
If we are committed to net-zero emissions by 2050, we will have only two decades in which to reduce or offset 100% of whatever annual emissions remain in 2030. Can we turn a blind eye to the fact that the greenhouse gas emissions embodied in our imports and our exports are adding to the global burden even as we may be reducing our domestic emissions during that time?
Please click on this link for my 2007 note as a PDF file.
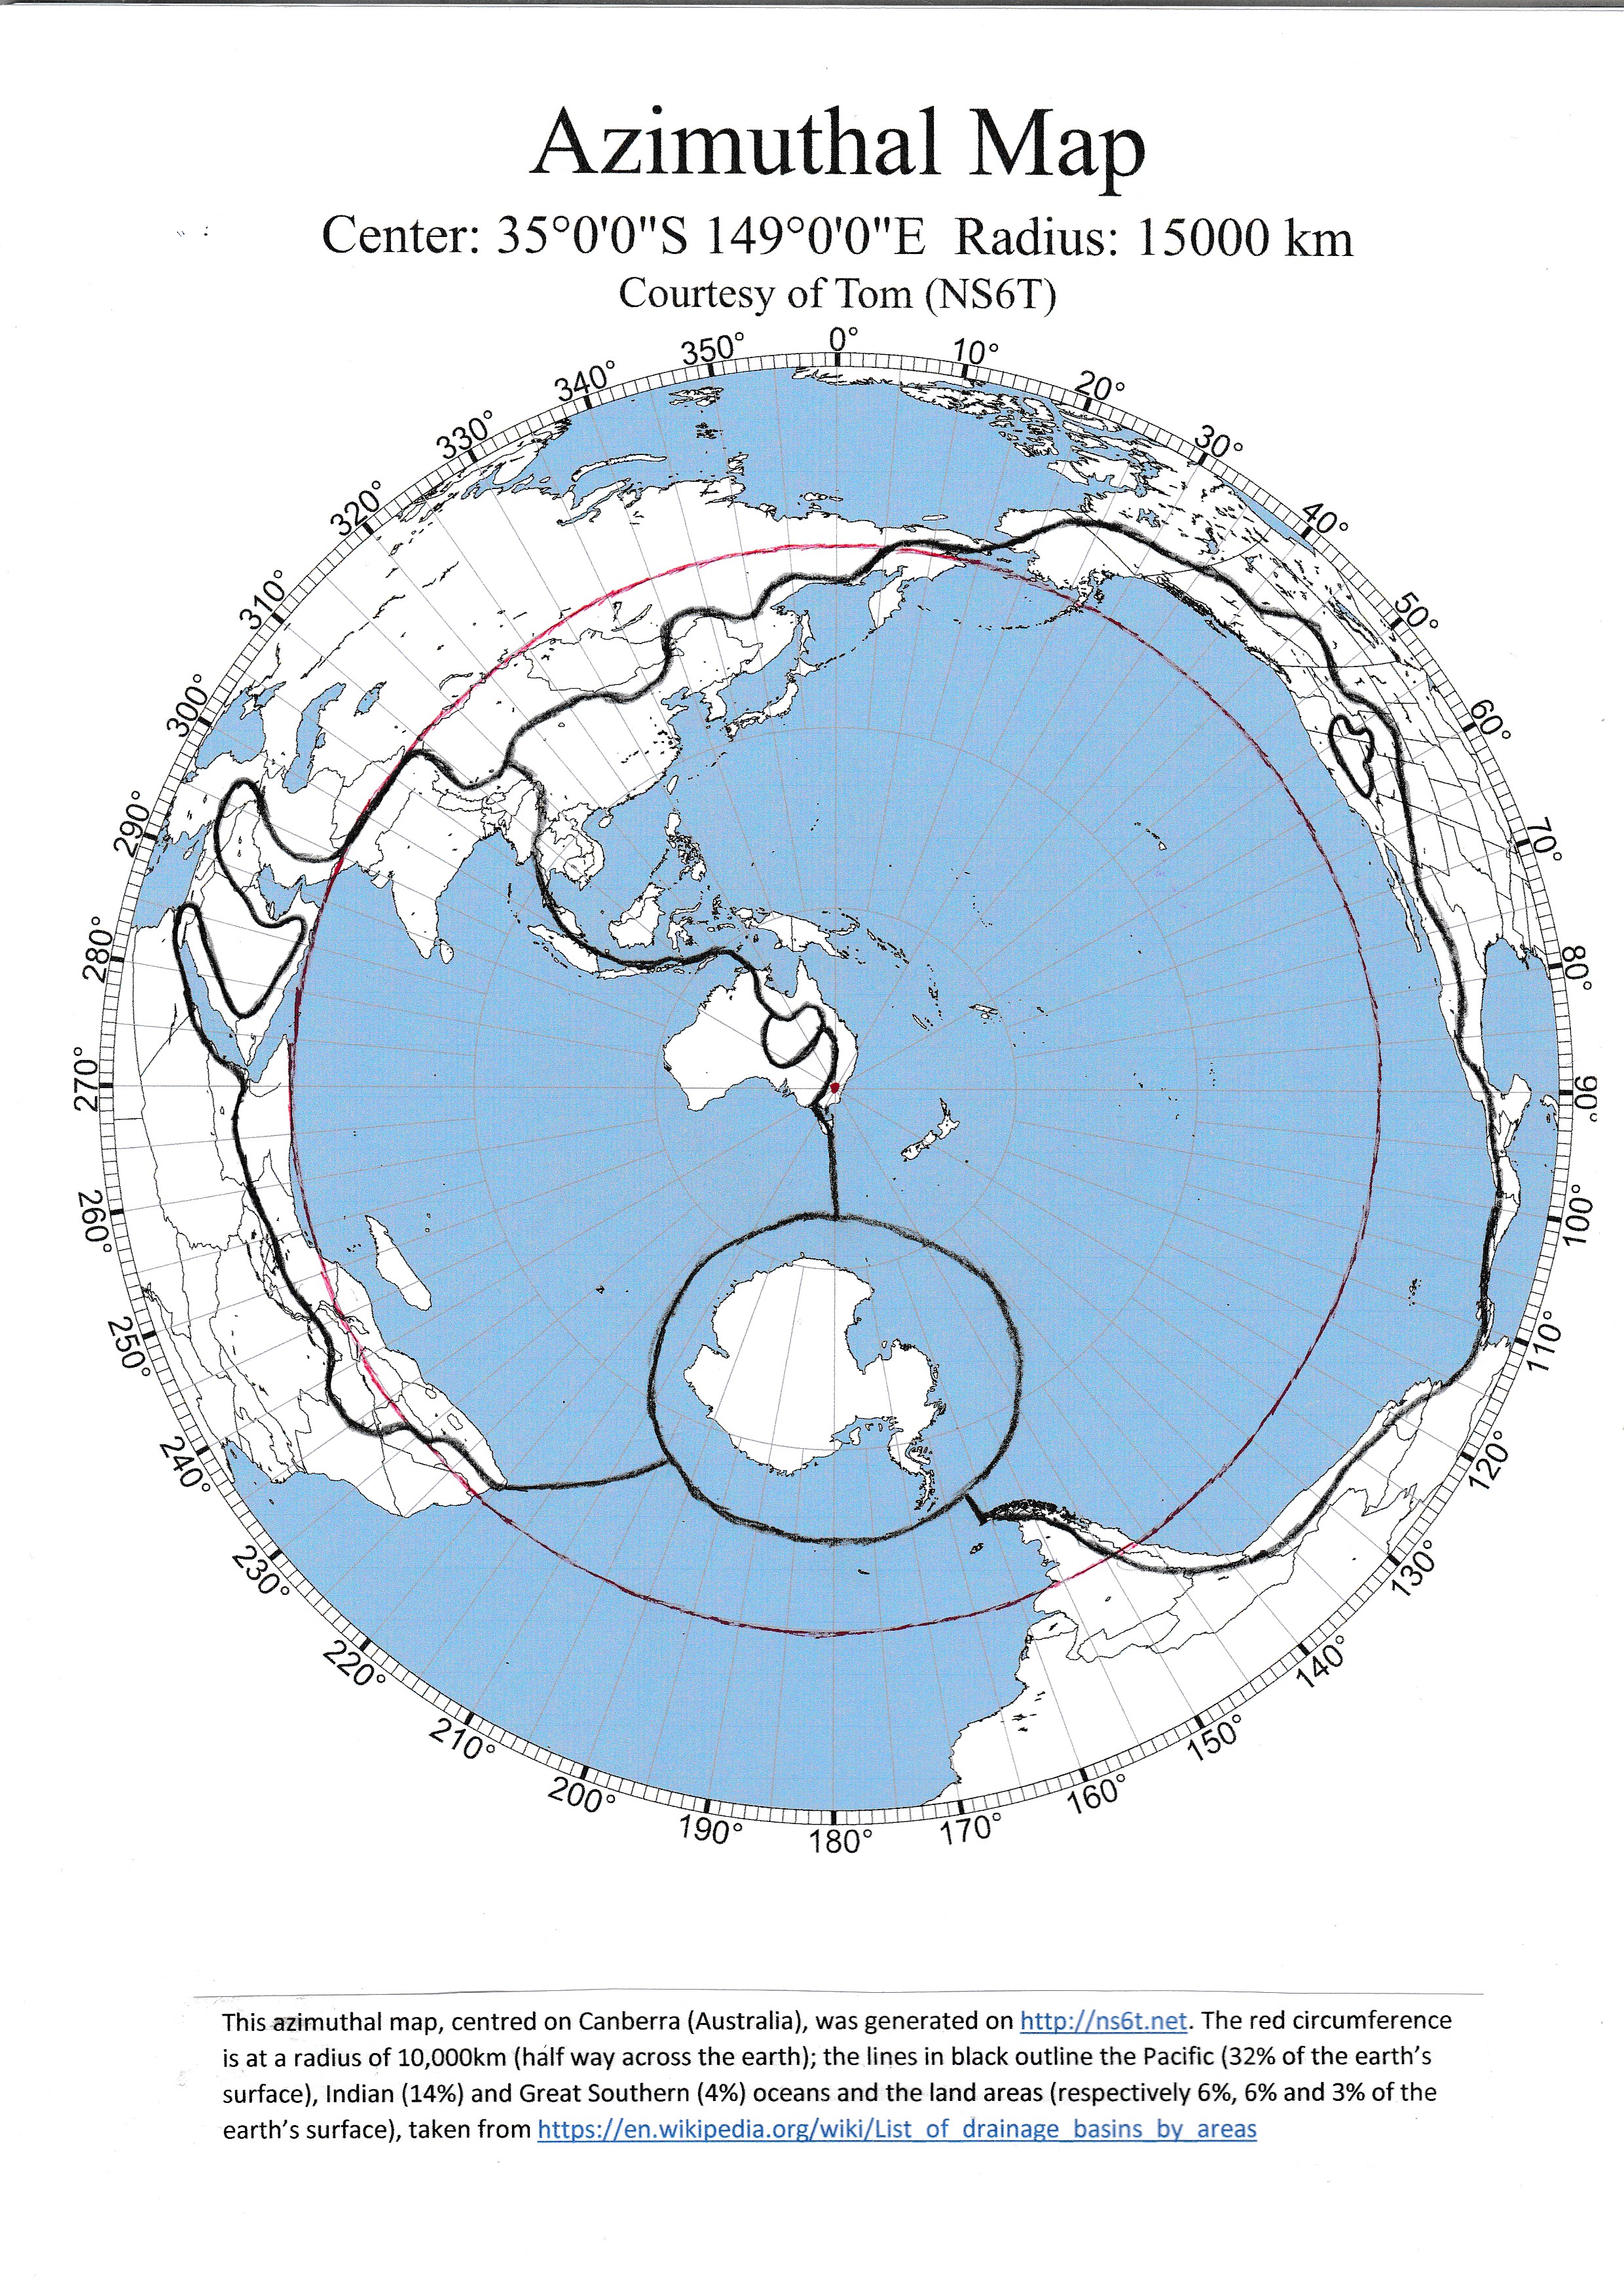
While I was preparing material for my course on Polynesia in 2016 I came across Tom Epperly’s tool for generating azimuthal maps at https://ns6t.net/azimuth/azimuth.html. An azimuthal equidistant map shows all points on the map at proportionally correct distances from the centre of the map, along azimuths or lines from the centre.
An azimuthal map centred on the Marquesas powerfully showed the vastness of Polynesia; one centred further west showed similarly the even greater extent of the Pacific Ocean. But as I discovered by centring maps on other places, and by reorienting them too, azimuthal maps can throw up other interesting geopolitical perspectives.
An azimuthal map centred on Canberra the capital of Australia, with azimuths projected out to include the entirety of the Pacific, Indian and Southern Oceans and the land areas draining into them, shows Australia to be near the centre of an oceanic hemisphere and geographically remote except for the nearby islands of Indonesia and the south west Pacific.
As the map shows, Canberra is more than half way across the globe (more than 10,000km) from North America, a little nearer to Africa and somewhat nearer to Antarctica and to parts of south east Asia. Both India and China are further away from Australia than south east Asia, while China is rather closer to the coterminous states of the United States of America than to Australia.
In this perspective it is hard to see Australia as either a prime target or an indispensable partner in any economic or military confrontation between northern hemisphere powers. As a small middle-order power Australia would have little impact on the outcome of any such confrontation and might simply be ignored during the confrontation, perhaps to be dealt with later by the winner.
Of course, Australia might chose to become involved in such a confrontation for reasons that could include: a desire to maintain global order; a need to protect vulnerable trade routes; a need to secure porous borders (including air and cyberspace); and a lack of capacity to ‘go it alone’ regionally for example in meeting obligations to its island neighbours.
In that event, though relative location has diminished in importance in a globalised world, Australia’s geographical isolation would not work to its advantage. With few significant near neighbours, its borders are open. No longer can it base its foreign policy on memories of the protective umbrella of a mother country (or of the World War II scenario in which Australia was important in the United States’ island-hopping strategy to regain its hegemony in the Far East and western Pacific).
This Canberra-centred map suggests that that Australia has little option but to take a more autonomous political, economic and military stance in the world than Australians have become accustomed to.


 As the map shows, Canberra is more than half way across the globe (more than 10,000km) from North America, a little nearer to Africa and somewhat nearer to Antarctica and to parts of south east Asia. Both India and China are further away from Australia than south east Asia, while China is rather closer to the coterminous states of the United States of America than to Australia.